Open loop gain
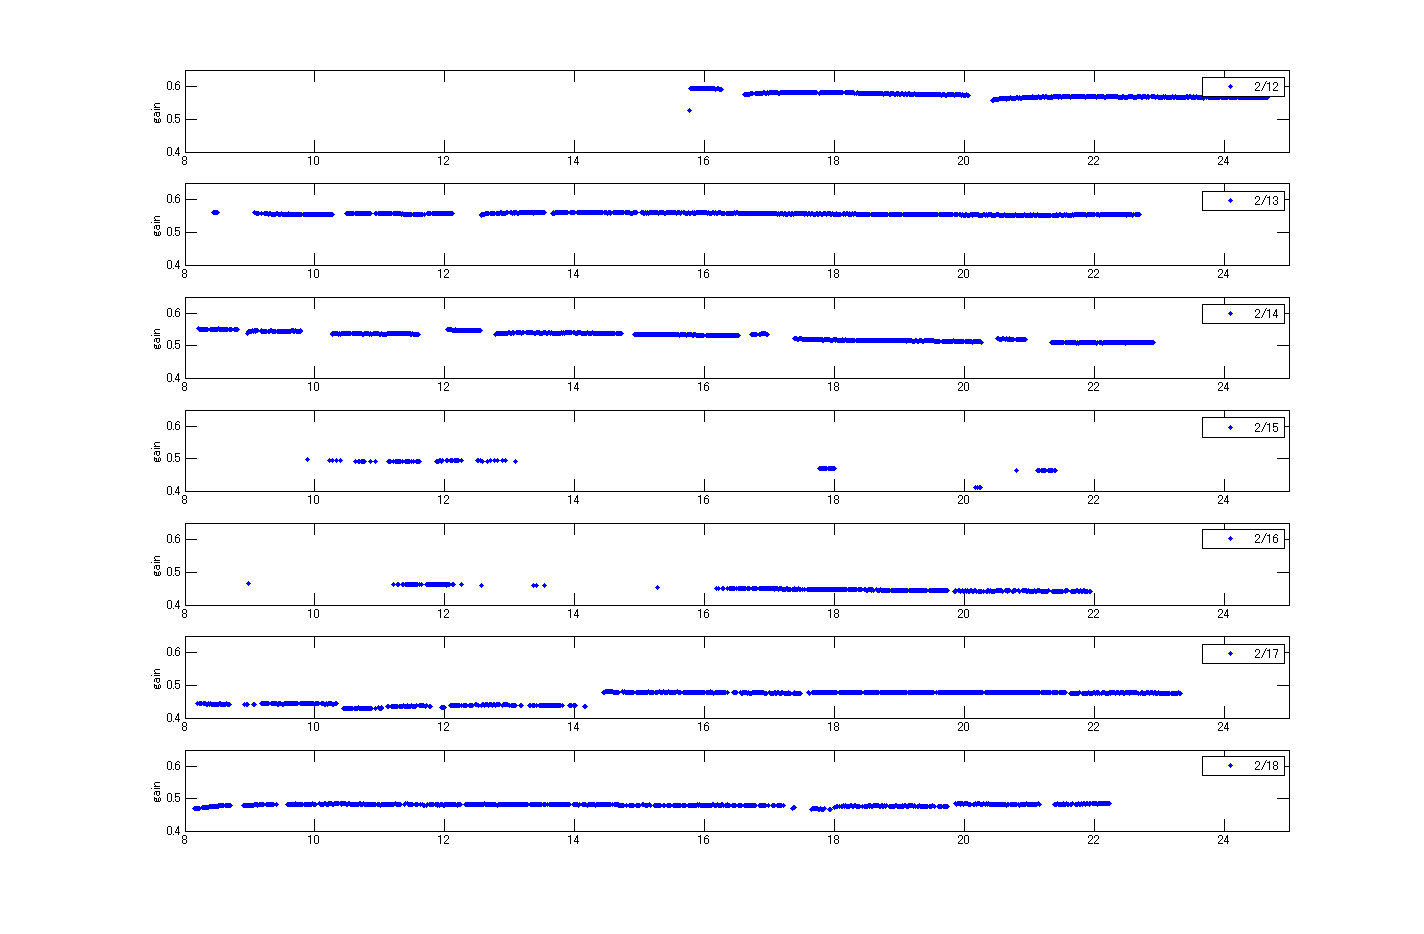
This time table shows the fluctuation of gain of open loop gain at 512Hz.
These figures represent 2/13, 14, 15, 16, 17 and 18 from the top to the bottom.
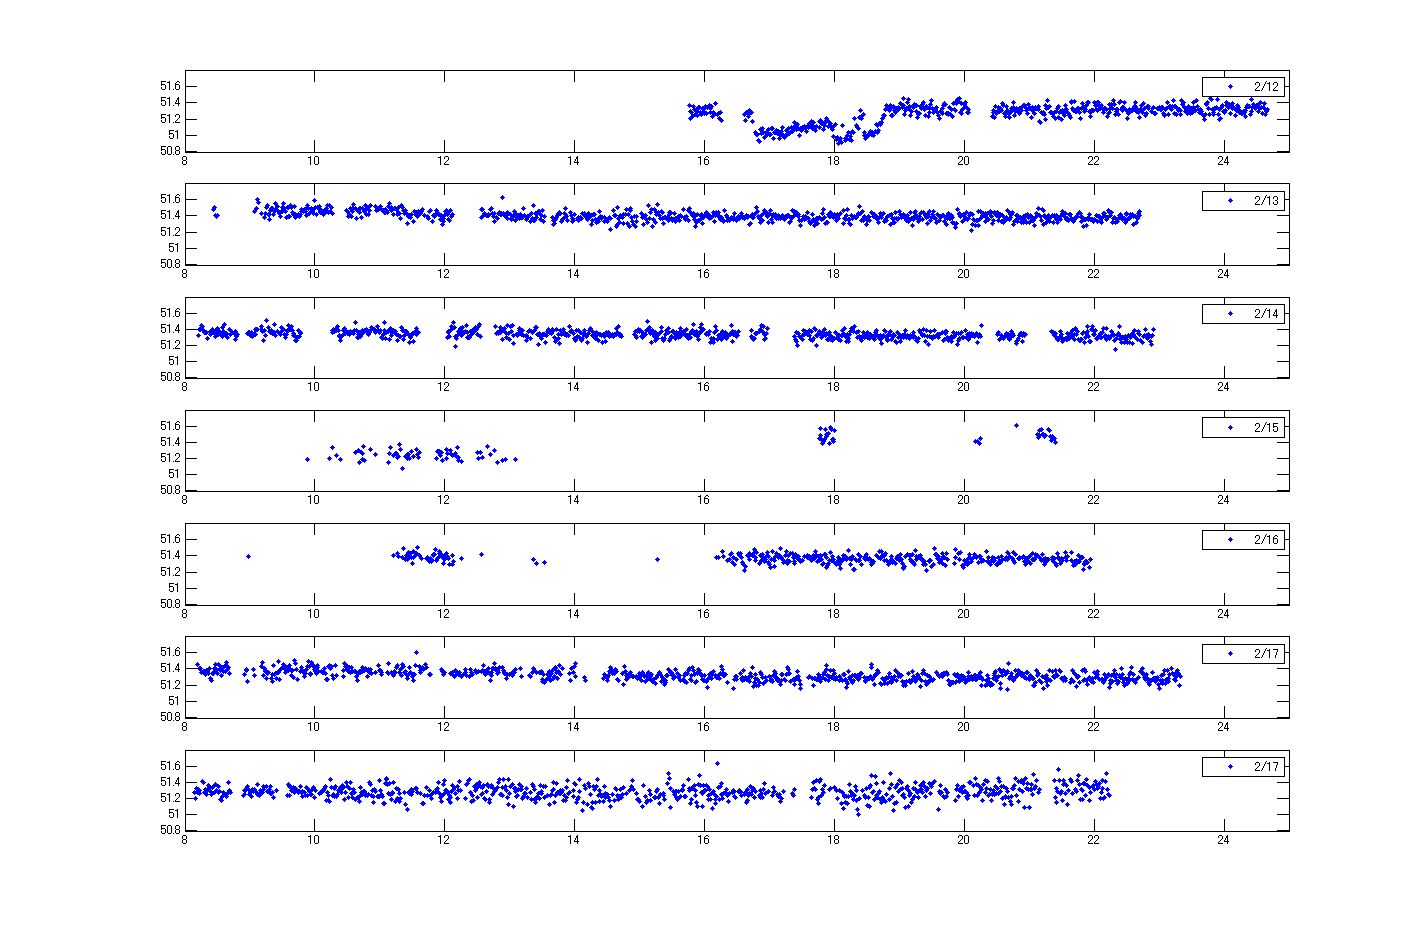
variation of spectrum
mean
| day | mean | standard deviation |
| 2/12 | 51.26 | 0.123 |
| 2/13 | 51.40 | 0.055 |
| 2/14 | 51.34 | 0.051 |
| 2/15 | 51.33 | 0.126 |
| 2/16 | 51.36 | 0.049 |
| 2/17 | 51.32 | 0.063 |
| 2/18 | 51.28 | 0.082 |
This time table shows the fluctuation of gain of open loop gain at 512Hz.
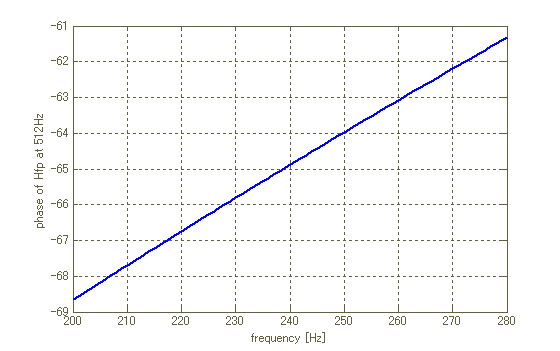
This figure shows a relation between a phase of Hfp at 512Hz and the cavity pole.
| day | mean | standard deviation |
| 2/12 | 0.573 | 0.0069 |
| 2/13 | 0.556 | 0.0025 |
| 2/14 | 0.529 | 0.0134 |
| 2/15 | 0.481 | 0.018 |
| 2/16 | 0.448 | 0.0063 |
| 2/17 | 0.464 | 0.0184 |
| 2/18 | 0.480 | 0.0032 |