|
|
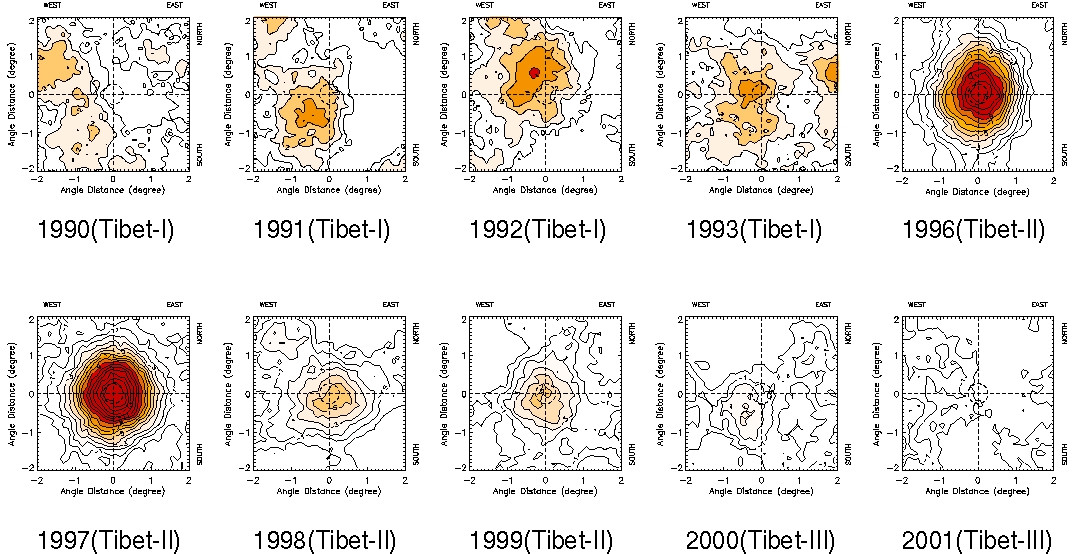
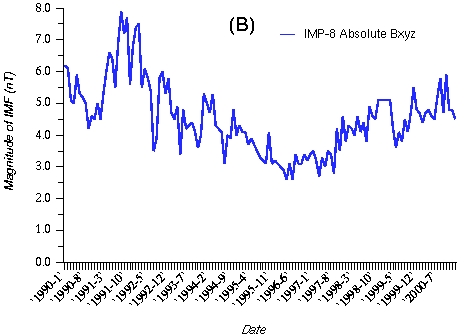
| Fig. 14 Yearly variation of "the Sun's shadow". Each figure represents a contour map of the weights of deficit event densities around the SUN centered at the figure. The contour lines are drawn from a level of no deficit, 0 sigma, with a step of 1 sigma. The mode energy is 10 TeV for the Tibet-I & II arrays and 3 TeV for the Tibet-III array, respectively. | Fig. 15 Time variation of interplanetary magnetic field observed by the IMP-8 satellite at the Earth orbit. |