|
|
|
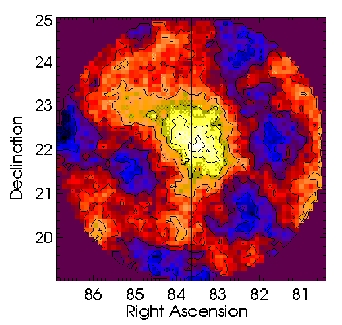
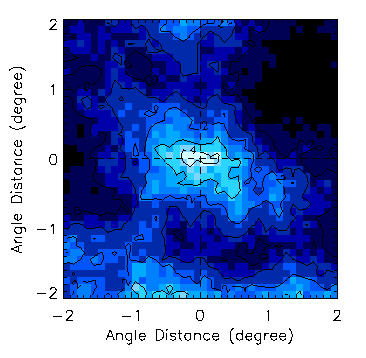
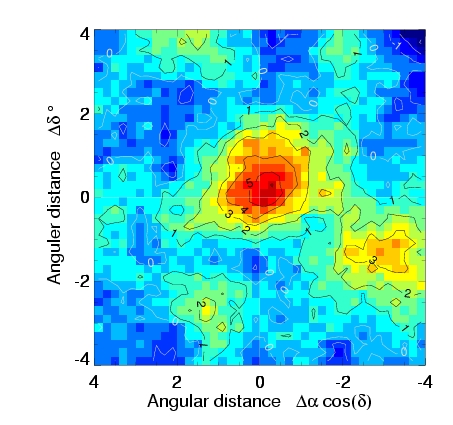
| Fig. 6 Contour map of the weights of excess event densities around the Crab Nebula centered in the figure. The contour lines are drawn with a step of 1 sigma. Angular distance is measured from the direction of the Crab Nebula along the right ascension (abscissa) and the declination (ordinate). | Fig. 7 Contour map of the weights of excess event densities around Markarian501 centered in the figure. The contour lines are drawn with a step of 1 sigma. Angular distance is measured from the direction of Mrk501 along the right ascension (abscissa) and the declination (ordinate). | Fig. 8 Contour map of the weights of excess event densities around Markarian421 centered in the figure. The contour lines are drawn with a step of 1 sigma. Angular distance is measured from the direction of Mrk421 along the right ascension (abscissa) and the declination (ordinate). |
 |
 |
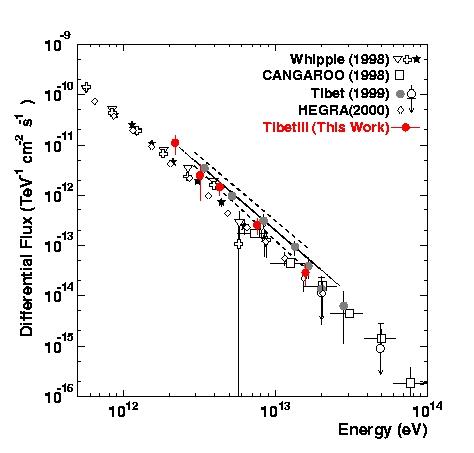
| Fig. 9 Energy spectra of gamma rays from the Crab Nebula. |
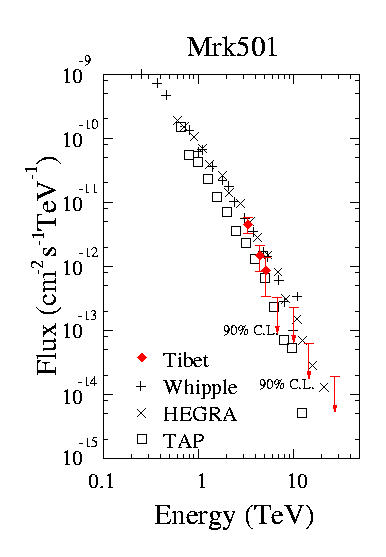
Fig. 10 Energy spectra of gamma rays from the Markarian 501. |
 |
 |
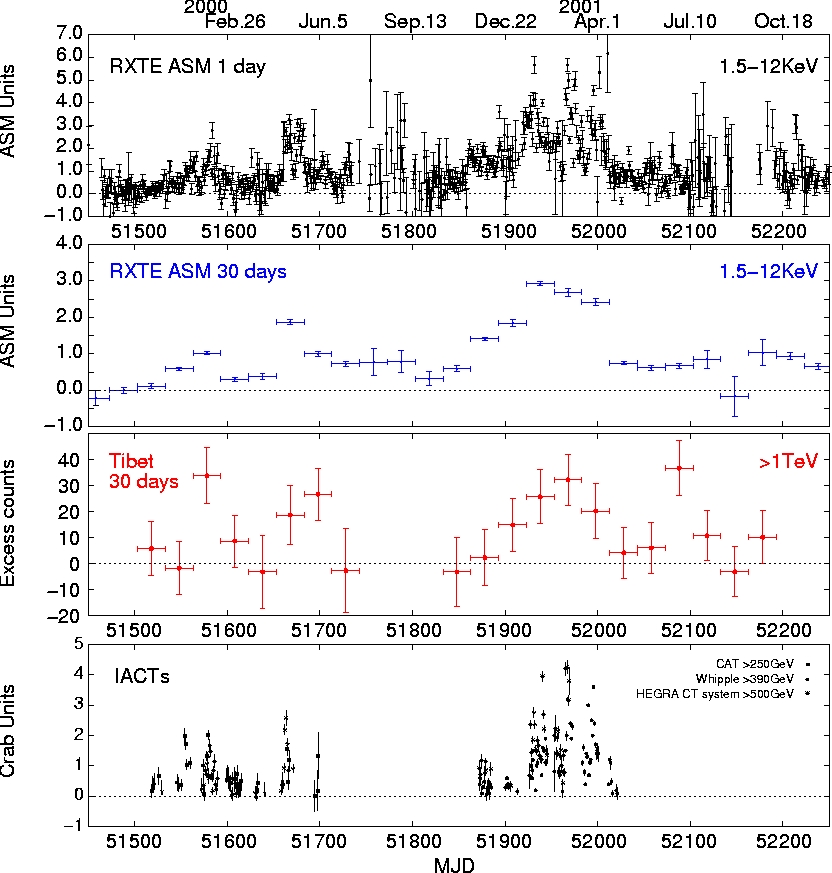
| Fig. 11 Time profile of our gamma-ray signals (31-day moving average) from Markarian 421. Also plotted is the correlation between our observation and those by X-ray satellite RXTE and Cherenkov TeV gamma-ray detectors. |
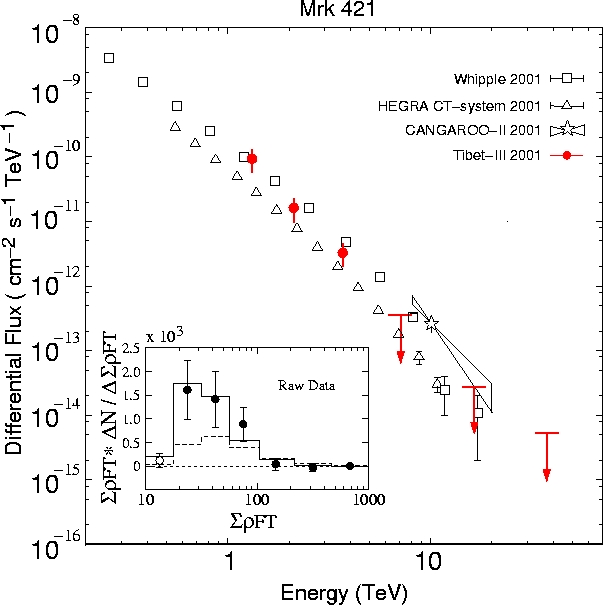
Fig. 12 Energy spectrum of gamma-ray signals from the Markarian 421. |