Top page » About TA
About TA
Outline of Telescope Array experiment
- Is there an upper limit of energies of cosmic rays?
- Where are highest energy cosmic rays generated and how do they come to the Earth?
- What particles are highest energy cosmic rays?
To explore the above-mentioned big mysteries, we constructed the Telescope Array (TA) that covers an area of 700 km2 in the desert of Utah in USA. It completed in March 2008 and we started the full observation. When highest energy cosmic ray reaches the Earch, it interact with a nucleus in the air and the number of particles increases in geometrical progression, and a group of more than 100 billion particles called "Air Shower" falls instantly on the ground. The TA detector consists of an array of 507 plastic-scintillator surface detectors deployed on a square grid of 1.2-km spacing, which is overlooked by air-fluorescenc-telescope stations that detect images of air-fluorescence light from air showers on three peripheral hills.
Keys of the experiment
What are the origins of highest energy cosmic rays? Are they active objects? Or unknown elementary particles?
Are the origins active objects?
- AGN: huge black holes and jets
- Gamma Ray Bursts: strongest explosions
- Magnetors: strongest magnetic field
- Merging galaxies, radio galaxies
Are the origins unknown elementary particles?
- Super-heavy particles generated at the initial stage of the Big Bang?
- Cosmic string, domain wall?
Observation by the TA experiment
- Measurement of energies of ultra-high energy cosmic rays (1017.5eV~1020.5eV)
- Measurement of energy spectrum of ultra-high energy cosmic rays
- The possibility that certain physics phenomina occur is large if we obtain kinks or rapid decrease in energy spectrum.
- GZK cutoff: If there is rapid decrease in spectrum around 1019.7eV, it can be an evidence for theoretical limit (GZK cuoff) that occurs as a result of energy loss by pion production from interaction of ultra-high energy protons with CMB photons.
- Ankle: An ankle of the spectrum around 1018.5eV can be an evidence for electron-positron pair production from the interaction of protons with CMB photons or the transition from Galactic cosmic rays to extra-galactic cosmic rays.
- Are ultra-high energy cosmic rays protons or irons? Do ultra-high energy gamma rays or neutrinos exist?
- Rapid decrease of spectrum at around 1019.7 eV can be an evidence for GZK cutoff from the interaction of extremely high energy protons with CMB photons.
- Search for ultra-high energy gamma rays and neutrinos
- There is a possibility that exotic phenomina occurs such as decay of super-heavy particles, cosmic string and magnetic pole, neutrino and anti-neutrino interaction (Z burst).
- There is a possibility of production of gamma rays and neutrinos from GZK process (p+γCMB→Δ→π+N).
- π±→μ±+νμ(anti-νμ)→e±+νe(anti-νe)+νμ+anti-νμ
- π0-->2γ
- Where do ultra-high energy cosmic rays come from?
- It is expected that highest energy cosmic rays travel almost straight in the Galactic magnetic field.
- If arrival directions of highest energy cosmic rays are correlated with characteristic active objects such as AGNs, the objects can be the origins of highest energy cosmic rays.
- There is a possibility that arrival directions of ultra-high energy cosmic rays are not isotropic and are correlated with Large Scale Structure of the Universe. We may obtain the information of Galactic magnetic field because lower-energy cosmic rays are affected by magnetic field.
The TA experimental group
TheTA group is an international collaboration by about 120 researchers (26 institutions) from Japan, US, Korea, and Russia (+Belgium). The number of Japanese members is about 60 (about half of the total members). We have our group meetings about three times per year mainly in Japan and US. We also had meetings at Ewha Womans University in Seoul in Korea, Institute for Nuclear Research of Russian Academy of Sciences (INR) in Moscow in Russia, and Universite Libre de Bruxelles (ULB) in Brussels in Belgium including TA analysis meeting.
The TA observation detector
The TA detector is the largest detector to observe ultra-high energy cosmic rays in the northern hemisphere as shown in Fig. 1. It consists of surface detectors (SDs) as shown in Fig. 2 and air fluorescence detectors (FDs) as shown in Fig. 3. The TA experiment uses AGASA-type plastic scintillator surface detectors and HiRes-type air fluorescence telescopes. We can confirm whether the discrepancy between the AGASA and HiRes result is originated from the systematic uncertainty from the different detectors. As an observatory of highest energy cosmic rays, Pierre Auger Observatory is operating in Argentina in South America in addition to the Telescope Array experiment that operates in Utah in USA. The advantages of TA are described as follows:
- Plastic scintillator are used for the surface detectors.
- The refurbished HiRes-I detector was transferred to the third FD station.
- The electron linear accelerator (Electron Light Source: ELS) was installed at the TA site, and end-toend calibration of fluorescence detectors will be perfromed by pseudo air shower generated by electron beams with the known total energy shot from an electron linear accelerator.
- The TA experiment uses plastic scintillator for surface detectors while Auger uses water tank. Plastic scintillator is sensitive to electromagnetic component of which energy fraction is about 90% of the whole air shower, and it is expected to have smaller effect from hadron interaction model or chemical component when we determine energy of ultra-high energy cosmic ray. On the contrary, the water tank used by Augerで is sensitive to muons that are expected to affect more for hadron interaction model and chemical composition. Thus it is expected that it is difficult to solve the difference in energy spectrum between the AGASA and HiRes results. The TA surface detectors were operated fully in March 2008, and we started hybrid observation together with air fluorescence telescopes.
- The issue of energy spectrum of highest energy cosmic rays is originated from the difference of the results between AGASA and HiRes. The HiRes-I のtelescope system was transferred to the north station site with minimal modification just changing the layout and trigger part. We will check on the HiRes telescope by using the TA telescopes at the TA site. The three telescope stations started full operation in November 2007.
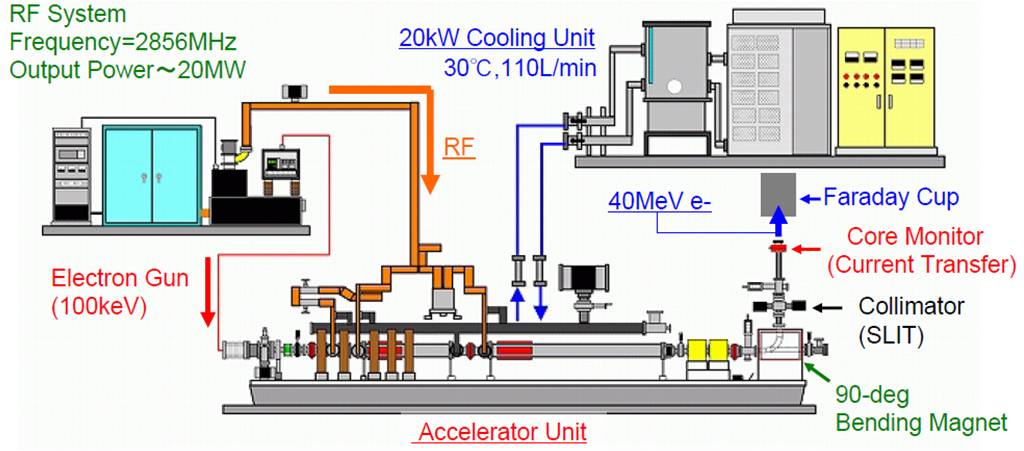
- The conventional calibration of the telescopes for the observation of air showers from ultra-high energy cosmic rays is integrate elements related to quantum efficiency of PMTs and fluorescence yield by measuring them absolutely. It is very difficult to integrate and control all the parameters because we may miss something or make careless mistakes. In order to avoid this risk, it is necessary to use a standard candle to perform end-to-end calibration of the whole telescopes at the experimental site.by electron beam from a compact electron linear accelerator with the following specifications:
- beam particles: electrons
- energies: 10、20、30、40 MeV (variable)
- pulse width: 1 μsec
- peak current: 0.16 mA (109 electrons (=160 pC/pulse)
- acceleration frequency: S band (2856 MHz)
- pulse repetition: 0.5 Hz
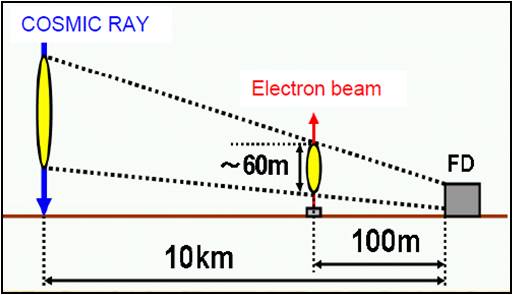
- distance from the BRM FD station: 100m (the pseudo shower induced by 109 electrons with an energy of 40 MeV 100 m in front of the FD station corresponds to an air shower of 1020 eV 10 km away from the FD station).
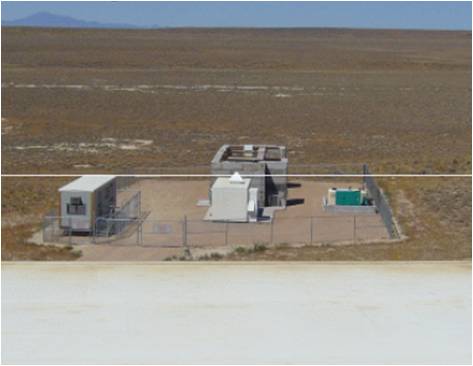
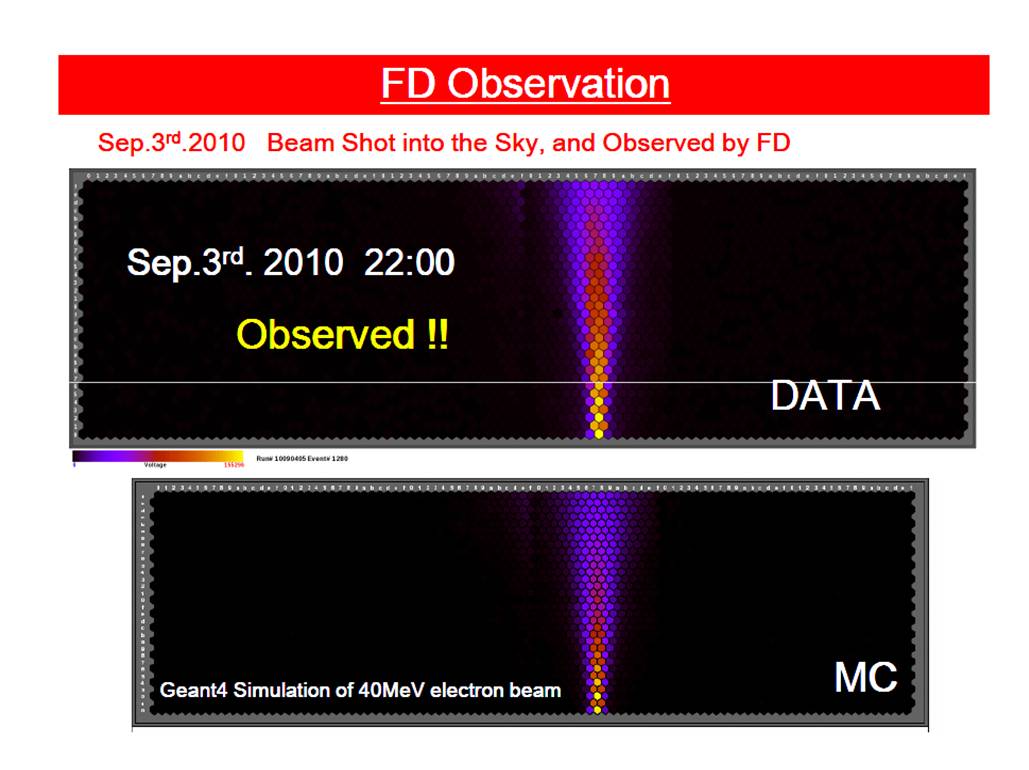
The end-to-end energy calibration of telescopes will be performed by observing pseudo air showers induced by electron beams that are shot vertically in the air with known total energy (Fig. 4). We mad an idea of the end-to-end absolute energy calibration of air fluorescence telescopes, which has not been performed by any other experiments so far. We used the technique and resources including used parts from the High Energy Accelerator Research Organization (KEK) with the help of staffs in the accelerator division. After the design (Fig. 5) was fixed, the assembly of an electron accelerator was completed around the end of 2007. The test of the performance of the accelerator started early in 2008 and ended around the end of 2008. We exported the ELS from Japan to US in March 2009 and installed it 100 m in front of the BRM FD station as shown in Fig. 6. The operation of the ELS started at the TA site in summer 2010. We shot electron beam from the ELS and took the image of pseudo air shower for the first time in September 2011. We will perform calibration of air fluorescence telescope with the ELS.
It is necessary to monitor the condition of atmosphere and measure atmospheric transparency to observe air showers at far distances. For the purposes, the following monitor system is being operated:
- LIDAR system
- A steerable Nd:YAG laser (355 nm) ) and a set of a telescope and a photodetector are installed in an astronomical dome 100 m away from the BRM FD station to measure backscattered light . We obtain atmospheric transparency along laser light by measuring time distribution of intensity of back-scattering light.
- Central Laser Facility (CLF)
- We have a CLF with a Nd:YAG laser to observe side-scattering light with air fluorescence telescopes. It is located at the position equidistant from three FD stations and is used as a standard candle.
- Cloud monitor
- It is necessary to monitor clouds regularly because the observation efficiency decreases when clouds exist. We identify clouds from temperature difference from night sky by using an infrared camera.
The photos and figures from the TA
The TA surface detectors and air fluorescence telescopes
.jpg) |
 |
| Fig.1: The layout of TA. The black squares represent surface detectors, and the green squares represent air fluorescence telescope stations. |
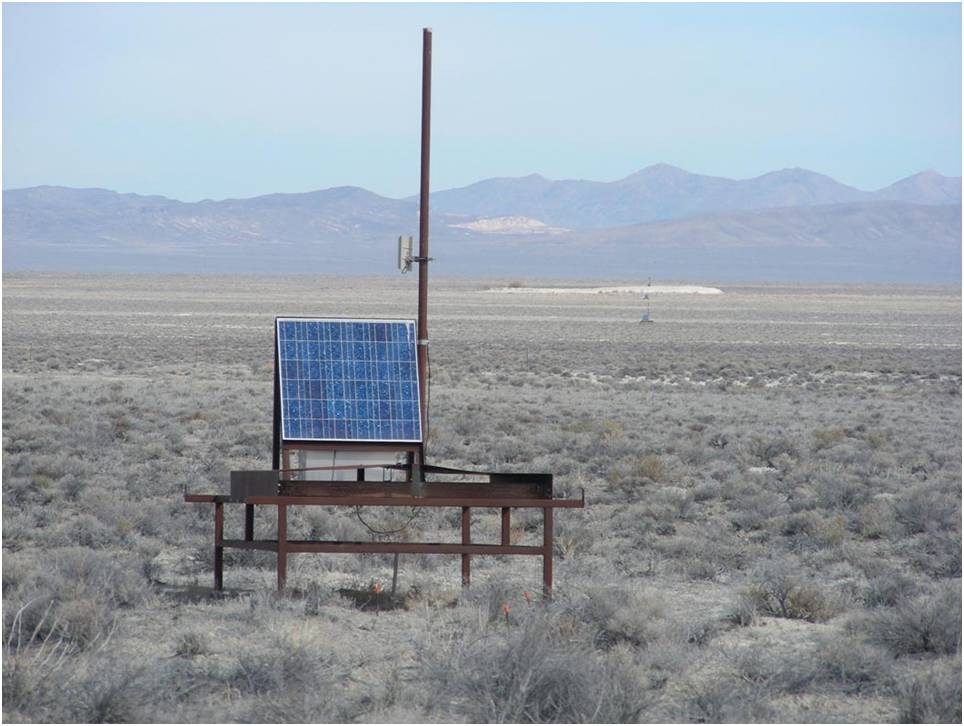
Fig.2: The surface detector deployed in the field. It has plastic scintillator with an area of 3 m2. |
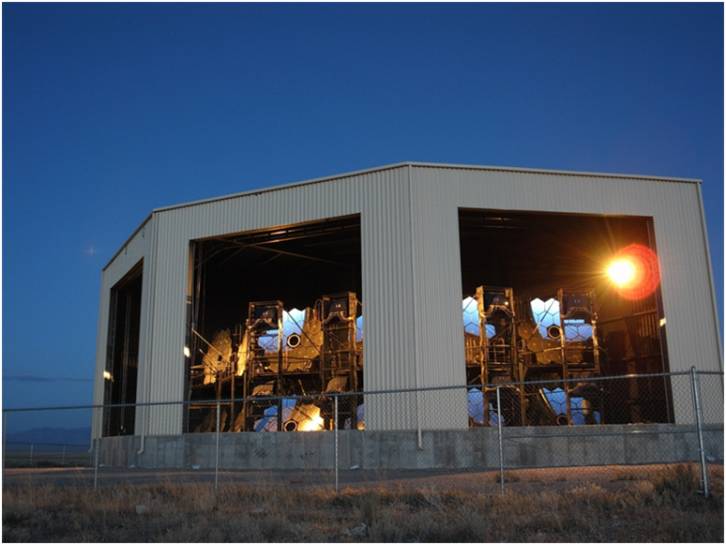 |
| Fig.3: The BRM FD station with twelve reflecting spherical mirrors. |
Related to an electron linac (Electron Light Source: ELS)
 |
 |
| Fig.: Layout of an ELS and a telescope station. |
Fig.5: Design of an ELS. |
 |
 |
| Fig.6: The photograph of an ELS deployed at the site. |
Fig.7: The image of the pseudo shower by the beam that was shot from ELS for the first time (upper). The image from Geant MC simulation (lower). |
The initial preliminary results from the TA experiment (Recent results are described in Publication)
Energy spectrum
 |
 |
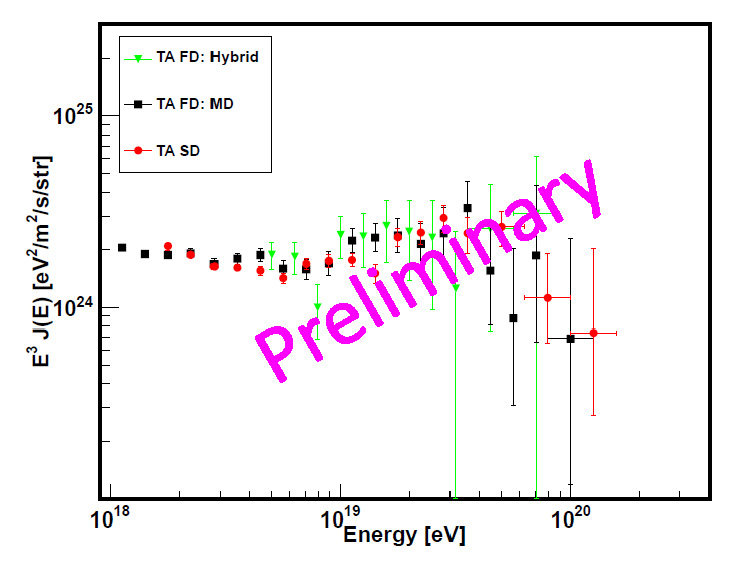
| Fig.8: The preliminary measurement of cosmic-ray spectra (multiplied by E3>/sup>) from the Telescope Array. The green downward triangles represent the hybrid spectrum, the black squares the monocular FD spectrum from the MD station, and the red circles the SD spectrum. |
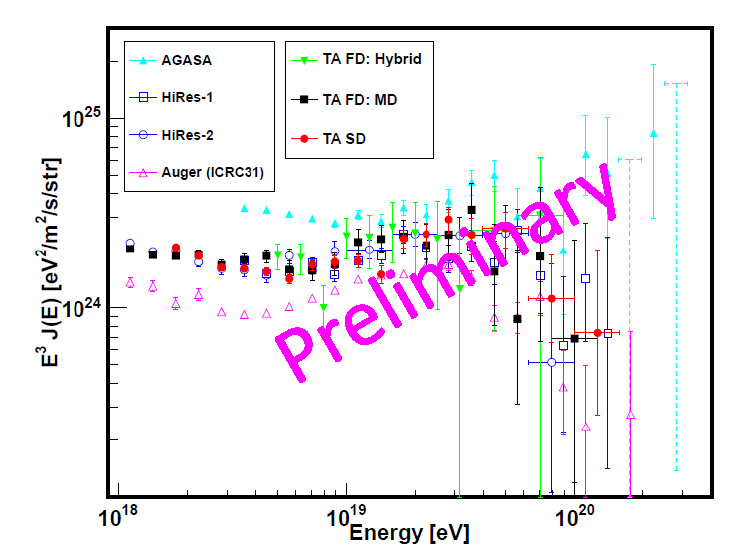
Fig.9: The preliminary spectra from the Telescope Array together with other experiments. The green closed downward triangles represent the TA hybrid spectrum, the black closed squares the monocular FD spectrum from the MD station, and the red closed circles the TA SD spectrum. The light-blue closed triangles represent the AGASA spectrum, the blue open squares the HiRes-I spectrum, the blue open circles the HiRes-II spectrum, and the purple open triangles the PAO spectrum. The light-blue dotted bars are 90% C.L. upper limits for the AGASA. |
Mass composition
.jpg) |
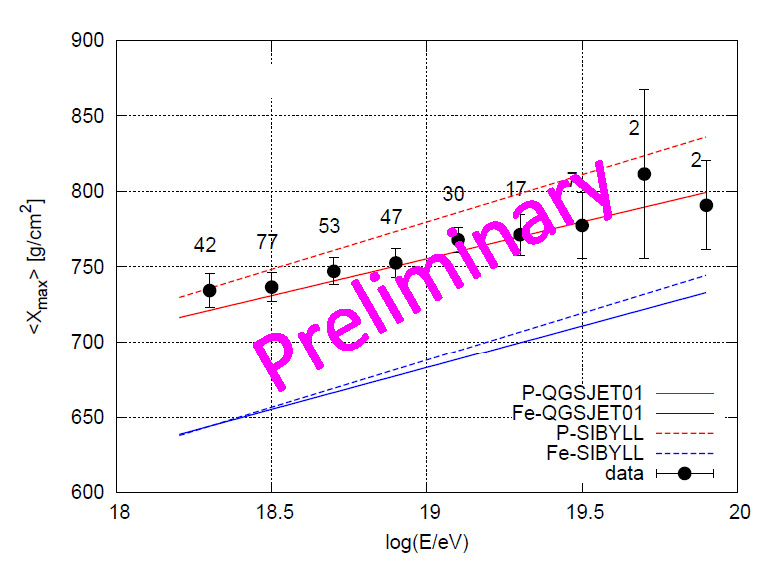 |
| Fig.10: The reconstructed Xmax for the TA stereo data (points) along with QGSJET-01 Monte Carlo data in the energy region from 1018.8 to 1019.0 eV. The red and blue histograms are the proton and iron predictions, respectively. |
Fig.11: The preliminary result of the average reconstructed Xmax as a function of energy. The black points are the TA stereo data. The upper set of red lines is the predictions for pure protons with the interaction models of QGSJET-01 (solid line) and SIBYLL (dashed line). The lower set of blue lines is under the assumption of iron. |
Correlation of arrival directions of cosmic rays with AGN
 |
 |
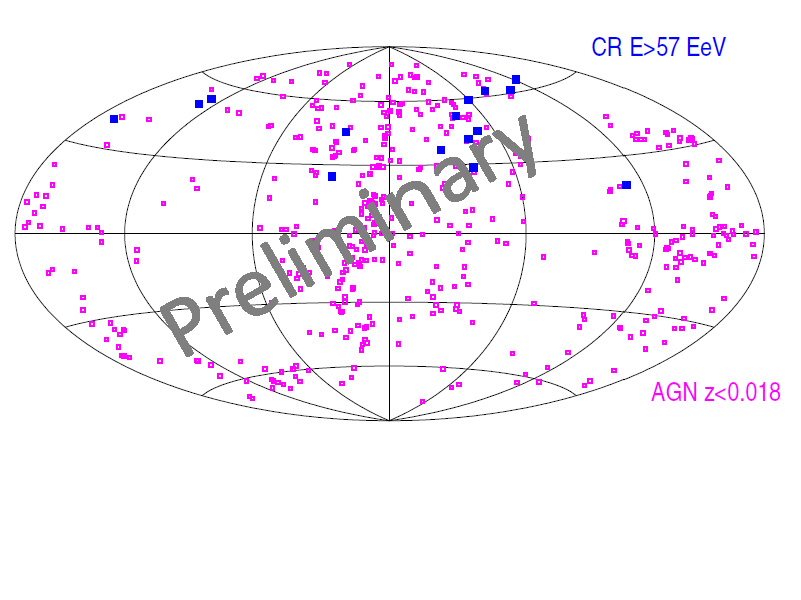
| Fig.12: Skyp map of the TA preliminary cosmic ray events (blue symbols) with E > 57 EeV and nearby AGNs from the VCV catalogue (pink symbols) in the equatorial coordinates. |
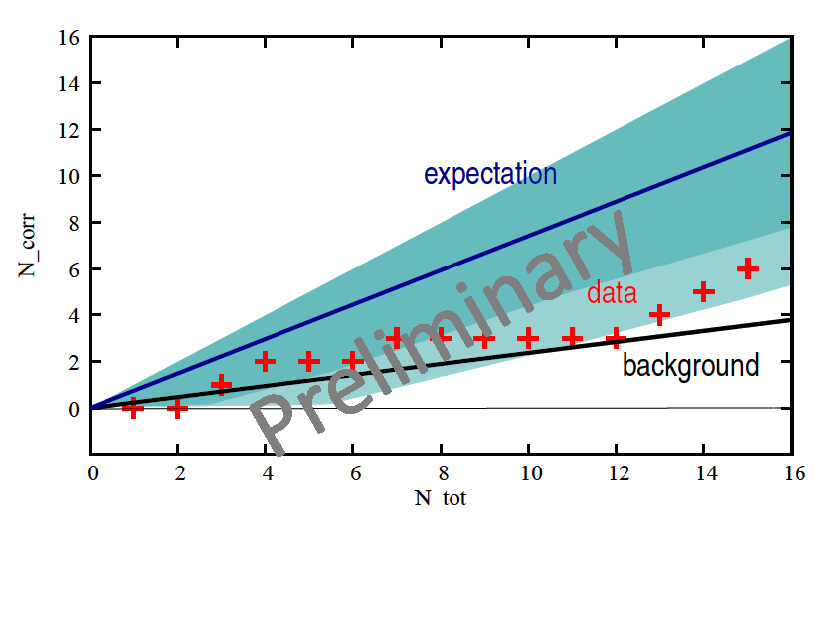
Fi.g13: The preliminary number of TA events with E > 57 EeV corrrelating with VCV AGNs as a function of the total number of events. The expectation according to the original Pierre Auger Observatory (2007) claim is shown by the blue line together with the 1- and 2- sigma significance bands. The black line shows the average number of random coincidences. |
Correlation with Large Scale Structure (LSS) and auto-correlation
 |
 |
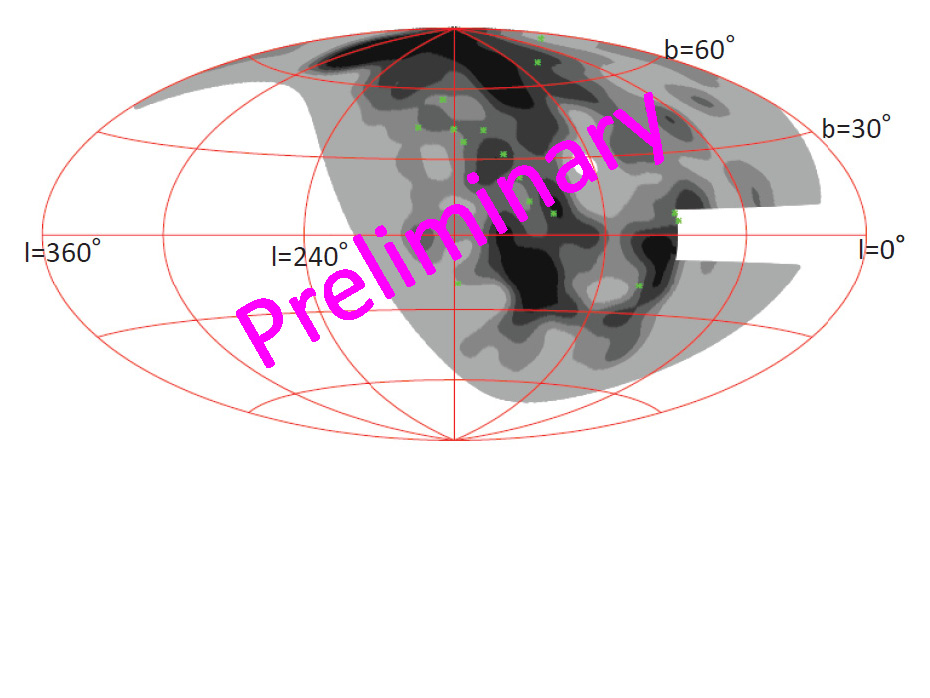
| Fig.14: The sky map of expected flux from LSS model together with observed arrival directions of ultra-high energy cosmic rays with energies above 57 EeV (green points) in the Galactic coordinates. Darker gray region indicates larger flux and each band contains 1/5 of the total flux. The smearing angle is 6o. |
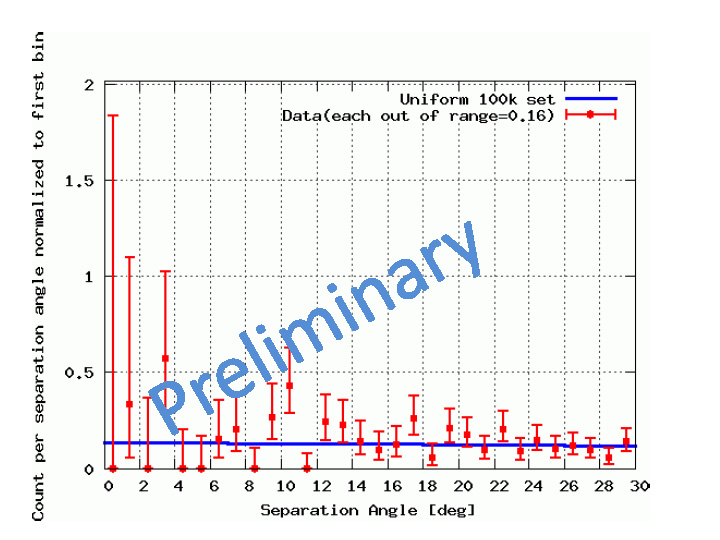
Fig.15: The preliminary distribution of separation angles for any two cosmic rays with energies above 40 EeV normalized by solid angle. The points are the observed data and the blue line is the isotropic model. Error bars represent the Poisson upper and lower limits at 68% C.L. |
Search for ultra-high energy photons
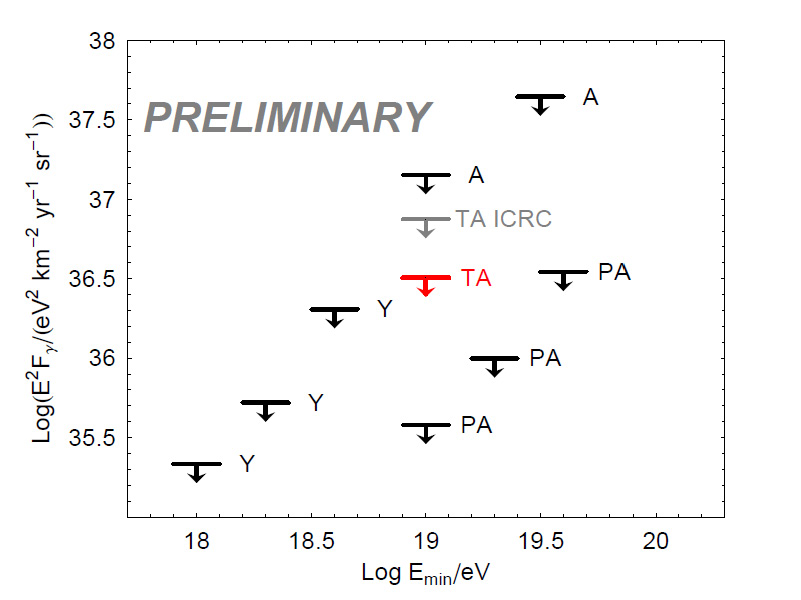 |
| Fig.16: Photon flux limits of TA preliminary data (red) together with those from AGASA (A), the surface detector of the Pierre Auger Observatory (PA), and Yakutsk (Y). |